
Inside the eye of Hurricane Epsilon viewed from a Hurricane Hunter aircraft near the top of the cyclone. The radar overlay (lower left) shows the aircraft entering the eye and the surrounding clouds. NOAA Image.
After the Record Breaking Hurricane Season 2020, What Will Happen in 2021?
Last January, no one expected the 2020 Atlantic Hurricane Season to close as the most active season on record. We had 31 tropical cyclones. All but one became tropical storms. Thirteen of the 30 tropical storms intensified into hurricanes, and six into major hurricanes. Twelve hurricanes or tropical storms made landfall in the contiguous United States. The previous record was nine. Twenty-seven storms broke previous records for the earliest formation beginning with Tropical Storm Cristobal.
The formation of a La Niña in the southeastern Pacific Ocean combined with an above average Atlantic Multi-Decadal Oscillation (AMO) fueled the record number of storms and the rate at which they formed.
The first annual meteorological discussion of the upcoming season takes place in mid-December just two weeks after the previous hurricane season ends. Colorado State University’s Tropical Meteorology Project issues the first possibilities for the coming season. Another authoritative body is Tropical Storm Risk, a consortium of tropical weather specialists.

The Seasonal Averages for the Atlantic Ocean, Caribbean, and Gulf of Mexico Increased in 2021 as NOAA changed the data set for determining averages to 1991-2020 from 1981-2010 which added 7 above average seasons to the data, including the record-setting 2020 Hurricane Season.
NOAA Infographic
2021 Hurricane Season Forecast Update April 2021
Each year, about two weeks following the end of the hurricane season, the first discussions of the next season are already taking place. Scientists consider factors like the current state the El Niño Southern Oscilliation (ENSO), the Atlantic Multi-Decadal Oscilliation (AMO), Ocean Temperatures, and three decades of seasonal averages. 2020 was the last year in which NOAA used data from the three decades 1981 to 2010. 2021 starts a new decade of averages from 1991 to 2020.
Long range season forecasts provide a glimpse at what might happen. They rarely provide a completely accurate outloook. In April of 2020, the season forecast included 16 named storms—half of what the season actually produced. By June of 2020, the forecast had increased to 24 storms, 12 hurricanes, and 5 major hurricanes with an ACE of 129-212. No one predicted the record setting season of 31 tropical cyclones, 14 hurricanes, and six major hurricanes with a total ACE of 180—far above average but not unexepected for far above average season.
Seven of the ten seasons from 2011 to 2020 were above average which contributed to the increase in seasonal averages.,
Comparison of Seasonal Averages
| 1981 to 2010 | 1991 to 2020 | |
| Named Storms | 12 | 14 |
| Hurricanes | 6 | 7 |
| Major Hurricanes | 3 | 3 |
| Accumulated Cyclone Energy (ACE) | 106 | 122 |
The increase in the number of named storms and hurricanes accounts for the change in ACE—the combined intensity and duration of Atlantic named storms and hurricanes occurring during a season. The ACE index is a wind energy index, defined as the sum of the squares of the maximum sustained surface wind speed (knots) measured every six hours for all named storms while they are at least tropical storm intensity. A season with an above average number of named storms should produce an above average ACE.
The current La Niña conditions in the eastern equatorial Pacific Ocean will likely diminish or transition to a neutral state through the season. The Atlantic Multi-Decadal Oscillation (AMO) remains positive and helps push the forecast to an above season.
Updated Season Forcase as of April 8, 2021
| Named Storms (14 average) | 17 |
| Hurricanes (7 average) | 8 |
| Major Hurricanes (3 average) | 4 |
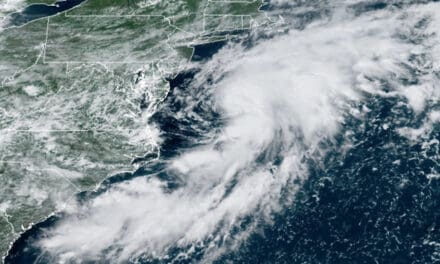
It only takes one hurricane or tropical storm to make landfall near your home for it to become an active season for you. Last year, Louisiana was hit hard by one storm after another.

Devastating Damage Following Hurricane Laura in Southwest Louisiana. Four more tropical cyclones would hit Louisiana before the season ended. Storm Surge damage exceeding 17 feet was documented along the coast.
El Niño–Southern Oscillation
One the leading indicators of Atlantic Hurricane Activity comes from the Pacific Ocean. The El Niño–Southern Oscillation or ENSO is the fluctuation of wind and water temperature over the tropical eastern Pacific Ocean which affects climate patterns in the tropics and subtropics.
El Niño is a sea temperature warming phase while La Niña is a cooling phase. High atmospheric pressure accompanies El Niño while low air surface pressure follows a La Niña. These periods of warming and cooling generally last about two months and occur approximately every two years with varying intensity. Science has yet to explain all the mechanisms that cause a La Niña or El Niño and forecasts for either condition remain uncertain beyond two or three months. That was the case in December 2019 through late winter 2020 when forecasters issued the first predictions for the 2020 Hurricane Season. In December 2019, a La Niña was somewhat possible but far from certain.
Although ENSO has a definite impact on the Atlantic Hurricane Season, it is not the only factor to consider. Rather, it shifts the chances for a specific weather pattern.
 El Nino (bottom)")
The upper image shows the cooler water temperatures—La Niña—near the equator in the eastern Pacific ocean. A La Niña promotes the formation of storms in the Atlantic Ocean, Caribbean Sea, and Gulf of Mexico.
The lower image shows warmer water temperatures—El Niño—which generally suppresses tropical cyclone formation in the Atlantic Basin.
A neutral condition of average water temperatures is the norm.
CSU and TSR Forecasts and Discussions
The Tropical Meteorology Project at Colorado State University and Tropical Storm Risk will issue their first forecasts for the 2021 Atlantic Hurricane Season on April 8 and April 9, 2021. They had their first discussion on the upcoming season on December 9 and 10, 2020.
CSU and TSR rely on two primary factors for the December outlook. The strength of the Atlantic Multi-Decadal Oscillation (AMO) and the phase of ENSO.
Historical Data provides a basis for forecasting the AMO component of the discussion. Three quiet hurricane seasons (low AMO) from 2013 to 2015 were followed by a slightly above-average 2016 season (increasing AMO.) The 2017 hurricane season had almost record-breaking levels of activity (high AMO) with above average activity in 2018 and 2019. We had an extremely active 2020 season. This leads to a high confidence that the AMO in 2021 will remain in a positive phase in spite of cooler than normal sea temperatures in the North Atlantic.
Forecasting the phase of the ENSO this far in advance is difficult and computer models produce wide-ranging forecasts for summer and fall of 2021. Most models indicate that La Niña will transition to a neutral phase, but statistical analysis points toward a continuing La Niña at a weaker magnitude than current observations.
Tropical Meteorology Project
The Colorado State University Tropical Meteorology Project anticipates five possible outcomes for the 2021 Atlantic Hurricane Season and assigns a percent chance to each possible outcome.
| AMO | El Niño | ACE | Chance |
| Very Strong | No El Niño | 170 | 25% |
| Above Average | No El Niño | 130 | 35% |
| Above Average | El Niño Develops | 80 | 20% |
| Below Average | No El Niño | 80 | 10% |
| Below Average | El Niño Develops | 50 | 10% |
Forecasters use the Accumulated Cyclone Energy (ACE) as a basis for long-range forecasts.
| ACE | Named Storms | Hurricanes | Major Hurricanes |
| 170 | 14-17 | 9-11 | 4-5 |
| 130 | 12-15 | 6-8 | 2-3 |
| 80 | 8-11 | 3-5 | 1-2 |
| 50 | 5-7 | 2-3 | 0-1 |
Averages from 1981 to 2010
- 1 Named Storms
- 4 Hurricanes
- 7 Major Hurricanes
- ACE ~ 106
Based on CSU’s discussion and probable outcomes, a 60 percent chance exists for an above average season with at least 12-15 named storms, 6-8 hurricanes, and 2-3 major hurricanes.
Tropical Storm Risk
TSR also expects a weak La Niña phase going into the summer and fall of 2021. The July to September trade winds affect vertical wind shear and the ability of cyclones to spin up in the main hurricane track through the Caribbean Sea and Tropical North Atlantic. Tropical Storm Risk expects weaker than normal trade winds which will enhance the ability of tropical storms to develop.
Tropical Storm Risk also warns that precision six months in advance of the season start is low, typically below 30 percent overall except for intense (major) hurricanes.
A 50 percent possibility exists for an above average (>126) ACE, 31 percent for near-normal (74-126) ACE, and 19 percent for a below-average (<74) ACE.
This aligns closely with the Tropical Meteorology Project discussion.
| ACE | Named Storms | Hurricanes | Major Hurricanes |
| > 126 | 16 | 7 | 3 |
| 74-126 | 9.5 | 4.5 | 1.5 |
| > 74 | 6 | 2.5 | 1 |

2021 Hurricane Season Forecast
Based on long-range assessments from the Tropical Meteorology Project and from Tropical Storm Risk, the 2021 Atlantic Hurricane Season will probably be an active season, but not as intense as the 2020 Hurricane Season.
Overall, we can probably expect 12 to 16 Named Storms of which 6 to 8 will become hurricanes and 2 to 3 will further strengthen to category 3 or higher.
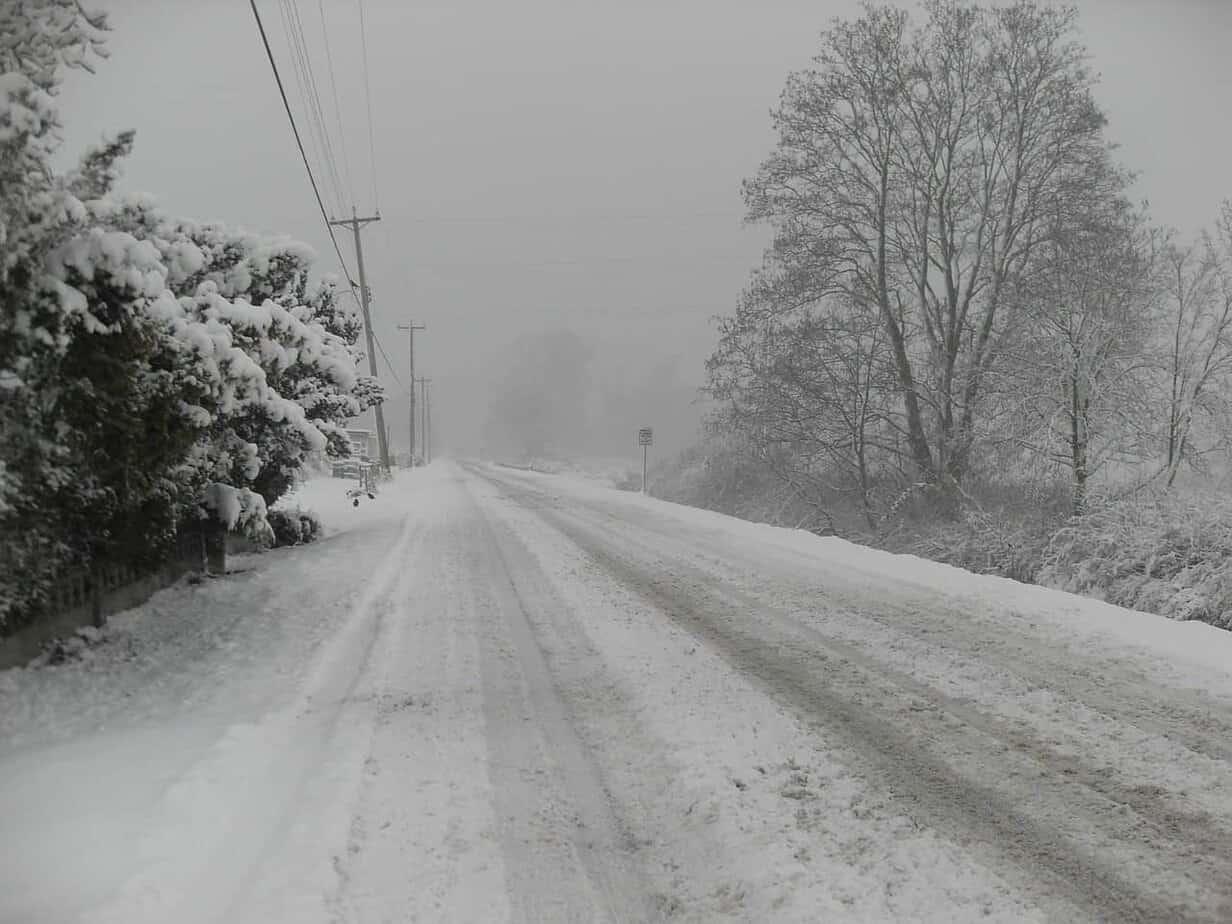
Tropical cyclones can form at any time of year.
- 2016: Hurricane Alex in January
- 2017: Tropical Storm Arlene in April
- 2018: Tropical Storm Alberto in May
- 2019: Tropical Storm Andrea in May
- 2020: Tropical Storm Arthur in May
- 2020: Tropical Storm Bertha in May
Each of the years from 2016 to 2020 was an above active season. If the trend continues, a tropical cyclone could form before the start of the 2021 Hurricane Season.
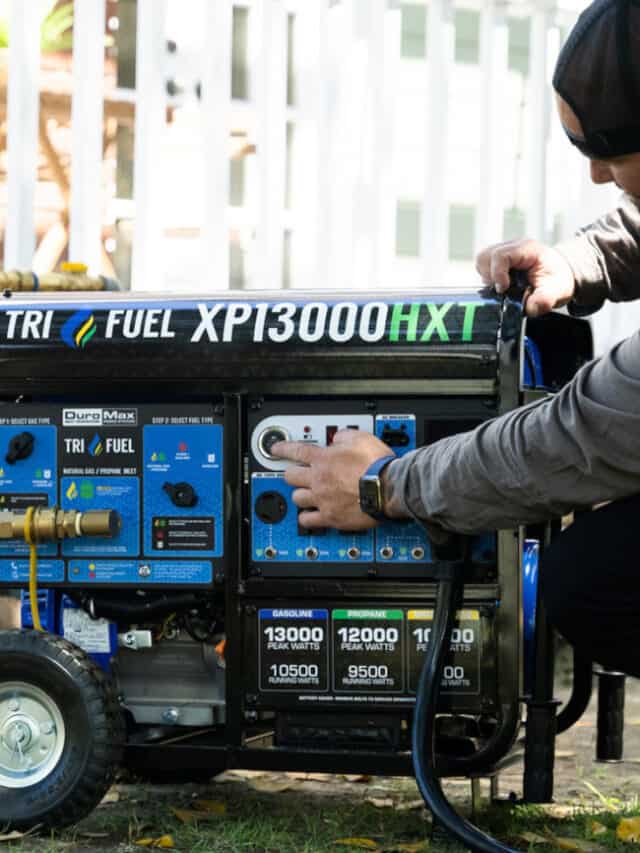
Are you ready?


